Infographics Accelerating Online Marketing Efforts
, Posted in: Inspiration, Author: nleavitt (December 28, 2013)
In one form or another, they’ve been around for centuries.
Infographics- to use a buttoned down definition, are basically an assemblage of data depicted in visual form.
In fact, one of the earliest infographics was created by Christophe Scheiner, a 17th century German priest, physicist and philosopher. In 1630, Scheiner wrote Rosa Ursina (1630), his magnum opus on sunspots. He used infographics to illustrate the sun’s rotation patterns.
Jump-start almost 400 years. In today’s often frenetically paced digital world, infographics have now become yet another important online marketing communications tool, not only for the private sector, but increasingly in the public sector too.
Ai Ching Goh, co-founder of Penang, Malaysia-based Piktochart, which offers both free and fee-based infographic solutions, says teachers and students create about 20 percent of the infographics on Piktochart. She added the company recently surpassed 600,000 users worldwide.
According to David Jenyns, founder of MelbourneSEOServices.com, a Melbourne, Australia SEO consultancy, while the technology to create infographics hasn’t changed dramatically over the past 12-24 months, what has accelerated its growth/usage is the speed in which infographics is shared.
“Services like Slideshare and Pinterest are encouraging more people to use infographics; clients are finding that infographics are especially good for various types of surveys to illustrate key findings,” said Jenyns.
“We are also seeing more and more animated infographics which essentially are huge animated GIF files as well as interactive and video infographics,” added David Wallace, who edits Infographic Journal, an infographics blog that is also a project of SearchRank, an Arizona search and social media marketing company.
And Amy Balliett, co-founder of Seattle-based Killer Infographics, said their firm’s private sector clients primarily use infographics to grow brand or product awareness or to showcase themselves as industry thought leaders.
Measuring ROI for infographics is also becoming easier to quantify.
“A lot of bloggers will repost an infographic using simple embed code provided with the infographic itself,” said Balliett. “That code will include an anchor link back to the original host of the infographic, which helps to grow inbound links quickly.”
But Balliett noted that ROI also depends on the project’s goals – if a client wanted to grow their social following, it might necessitate creating a humorous infographic that would play well in social media. If a client wants backlinks from industry sites, then a thought leadership infographic would be more appropriate.
“Marketers have to come to the table with a well-executed infographic to get any traction and then measure success based on the infographic’s goal,” she said.
In addition, Wallace said you can measure how many social shares occur in the two to three week timeframe that they are published.
“You can also monitor new inbound links the infographic generates. And finally, you can look at analytics to see what kind of traffic they generate and more importantly, what that traffic does after landing on the infographic page,” said Wallace.
Balliett added that one of her company’s most successful infographics was for an online educational lead generation company that wanted to build links for their IT schools’ website. Called ‘Geek versus Nerd,’ Balliett said the infographic generated more than 3,000 reposts on key targeted sites like Geek Tyrant, Search Engine Journal and Wired.
“The client received more than 200 backlinks from these posts and to date, the infographic has gotten more than 10,000 tweets, stumbles and Facebook shares independently,” said Balliett.
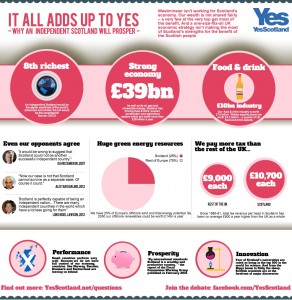
And a recent example of how a non-profit organization utilized infographics to drum up some publicity was a Piktochart-generated infographic for YES Scotland. Stewart Kirkpatrick, whose title there is Head of Digital, said his organization wanted to convey a lot of complex information in a graphic that would be both engaging and easy on the eye. The infographic
 has been viewed widely on the YES Scotland Facebook page.
As 2014 looms, look for infographics to continue to grow in popularity, even though, noted Balliett, costs for infographics have actually increased – it has nothing to do with technology as the tech improvements the past few years haven’t made design any faster.
“With thousands of infographics going online every day, it’s essential that brands release infographics with high quality design and research to see any success – and to get this kind of quality, brands have to pay for experts,” said Balliett.
And it’s the sharing element that really adds value, noted Jenyns.
“If someone creates an infographic that’s interesting enough that the viewer wants to share it, it will create a ‘viral’ effect and that’s brilliant marketing.”
Comments
Comments are closed.