

Feature Story
More feature stories by year:
2024
2023
2022
2021
2020
2019
2018
2017
2016
2015
2014
2013
2012
2011
2010
2009
2008
2007
2006
2005
2004
2003
2002
2001
2000
1999
1998
 Return to: 2015 Feature Stories
CLIENT: IDTECHEX
Oct. 13, 2015: EBN
Jon Harrop, Director, IDTechEx
The 3D printing industry will grow from $2.5 billion in 2015 to $20 billion in 2025. This growth is due to both improvements in existing printing technologies and the development of completely new technologies.
IDTechEx Research has been tracking the 3D printing industry for years by attending events and interviewing major players. All of the information is collated in comprehensive databases of manufacturers, service bureaus and printers with 433 3D printers assessed from manufacturers around the world. The database is regularly updated and provides a solid foundation for assessing the current state of the market, as well as forecasting how things will change in the future. In particular, it is easy to identify key differentiators between technologies and vendors using this information. However, it is not always easy to analyze or visualize the data, so we have adopted some novel techniques to help.
In the case of printers, the database provides detailed quantitative information on technology type, build volume, build speed, precision, machine price and other elements for hundreds of different machines - ranging from consumer-level products to high-end industrial manufacturing for aerospace. Common forms of analysis, such as principal component analysis (PCA), a machine learning algorithm, can be used to study the data in order to spot interesting features such as key differentiators in terms of characteristics (e.g., speed and price or combinations thereof). There are also many different ways to visualize this data.
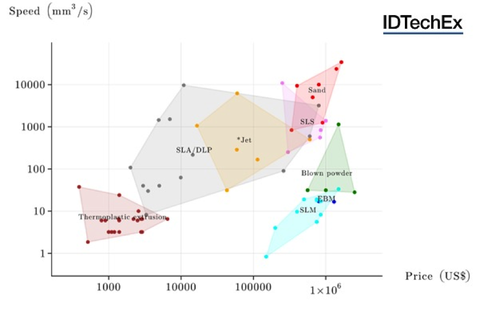
Our favorite approach to visualizing data entails choosing a pair of axes, such as price and build speed, and plotting each printer as a colored dot according to its technology type. The regions of the price-speed plane occupied by different technologies may then be highlighted by drawing the convex hull that surrounds the points for each technology in its color. Due to the huge variations in all characteristics, we use log scales throughout.
The following figure shows one such diagram for price vs speed:

Source: IDTechEx Research report 3D Printing: 2015-2025: Technologies, Markets, Players
This diagram immediately shows the regions occupied by the different 3D printing technologies - with thermoplastic extrusion in the bottom left quadrant (low price and low speed) to sand printing at the top right (high price and high speed) and selective laser melting of metals in the bottom right (high price and low speed).
The plastic printing technologies (thermoplastic extrusion, SLA/SLP, *Jet and SLS) offer increasing speed with increasing price starting with thermoplastic extrusion and going through SLA/DLP and jetting to SLS. For plastic printers, the price vs speed trade-off is the single biggest key differentiator between the products on the market.
In contrast, metal printers vary greatly in terms of speed but relatively little in terms of price. Specifically, speeds range from 1 to 3,000mm³/s whereas prices range from $150k to $3m. When it comes to metal 3D printers, price is clearly not the main differentiator.
In terms of progress in 3D printing technologies, the upper left quadrant represents printers that are both cheap and fast. This is clearly sparsely populated today. Several players are pushing into this region including Carbon3D's high-speed vat photopolymerisation and HP's high-speed Multijet Fusion.
You can see the latest 3D technology in action, and learn more about the future of this market, sy the IDTechEx event 3D Printing USA on November 18 to 29 in Santa Clara, Calif.
Return to: 2015 Feature Stories